When you start to keep an eye on the frame rate of your game, chances are you will start with the official solution: Unity Profiler. Indeed, most times the built-in profiler is more than enough to know what’s causing frame rate drops. Though, the profiler is slightly limited when it comes to anything that’s happening on the GPU - you only know vaguely in which pass the GPU is suffering, but you must use your experience or educated guess to pinpoint the exact problem.
Nsight Graphics and Render Doc are used for frame debugging (mostly), and the timer in the frame debugger is not much better than Unity’s built-in profiler.
C++ Capture was a trick that I discovered myself to gain extra insight into performance issues. It still uses Nsight Graphics - usually we can’t access the GPU counter when launching Nsight, because that requires running Unity in admin mode, which Unity directly says Don’t do it.
The idea is simple: launch Nsight in frame debugging mode as usual - no admin privilege needed, and then play the game. Capture a frame, and then hit Export C++ Capture. Build the C++ capture, and launch the C++ capture with GPU Trace in admin mode. And there you can get all the analytics about shader bottlenecks and more accurate timer values.
There’s a small catch: this method isn’t guaranteed to work. You could fail to export a capture, or the capture crashes your Nsight when attempting to use GPU Trace on it.
Step-by-Step Guide
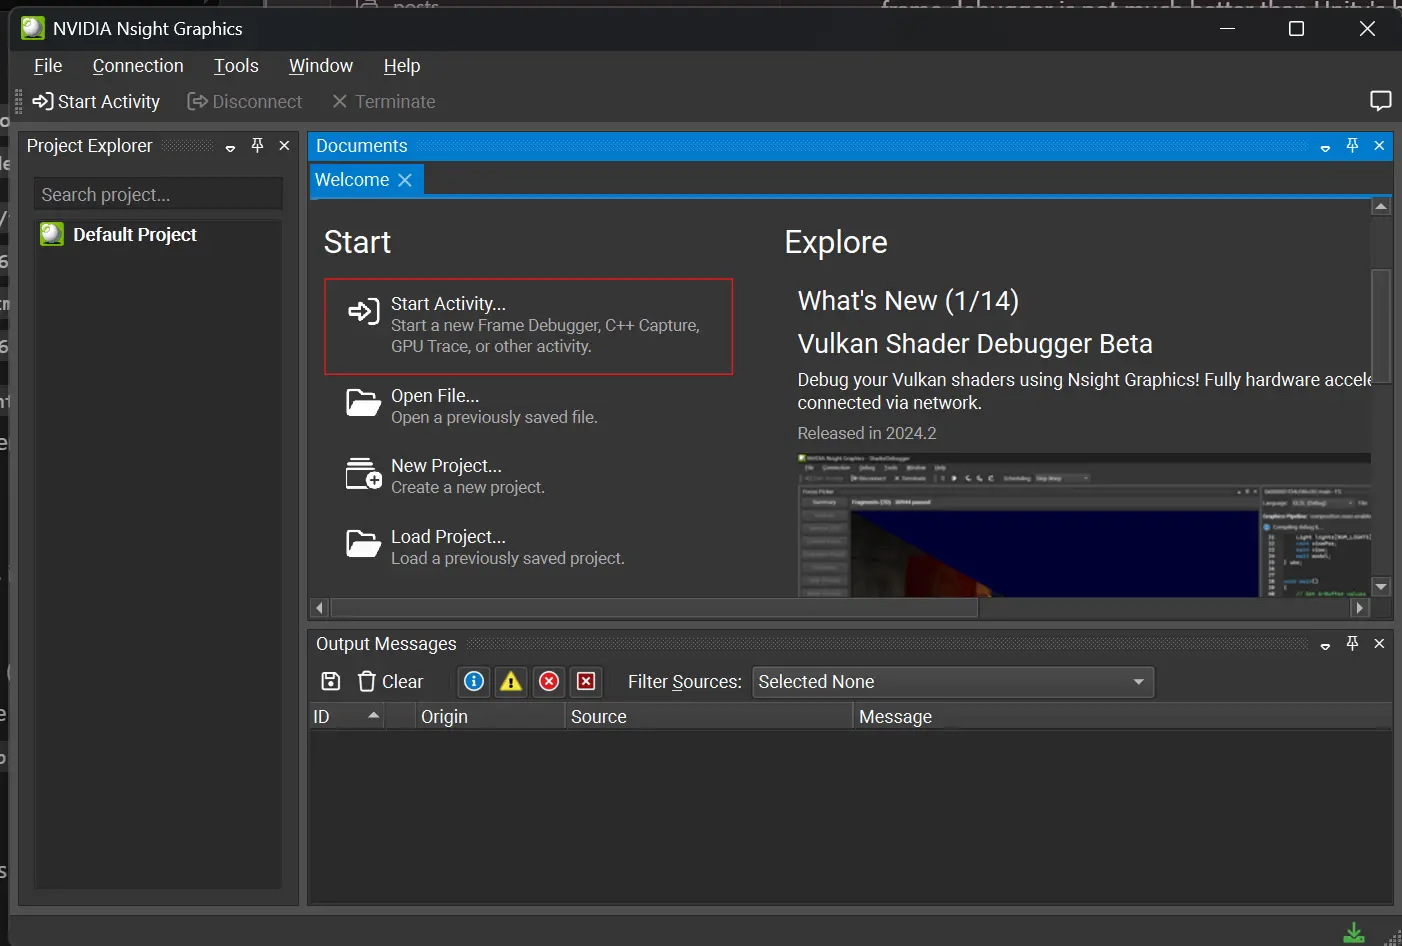
First, launch Nsight, and click Start Activity:
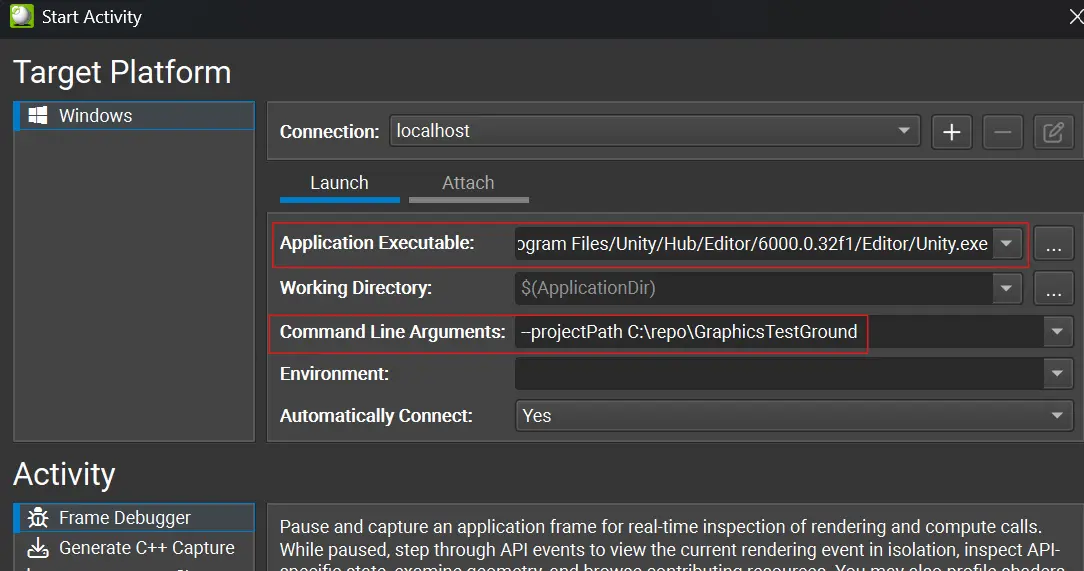
In the pop-up, fill Application Executable with the path to Unity Editor executable (if you are not sure where it is located, check out the Installs tab in your Unity Hub).
Then, fill Command Line Arguments with --projectPath {path to your project}. You can also add other arguments specified here.
Make sure in Activity, you are launching Frame Debugger.
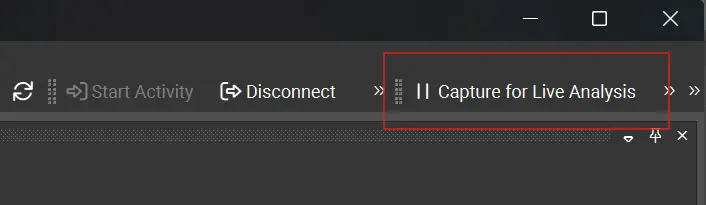
The editor should launch, and when it finishes, play the game regularly till you meet a performance critical scenario. Either hit F11 to capture or click Capture for Live Analysis on the upper-right corner of your Nsight:
Sometimes it can be tricky to capture the window you want… to save yourself from such a hassle, maximize the game view before capturing.
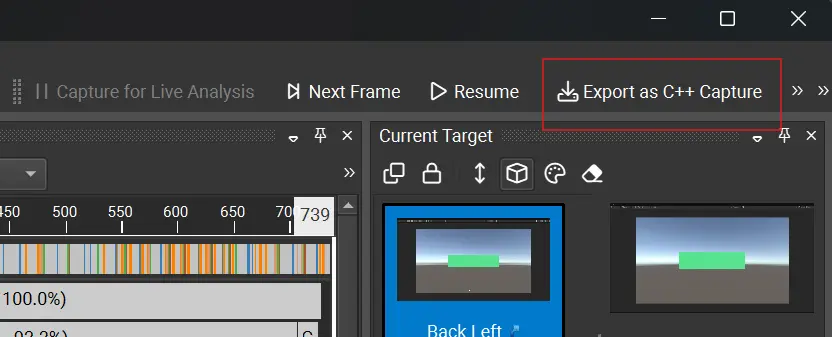
Still on the upper-right corner, there should be an Export as C++ Capture button, click that.
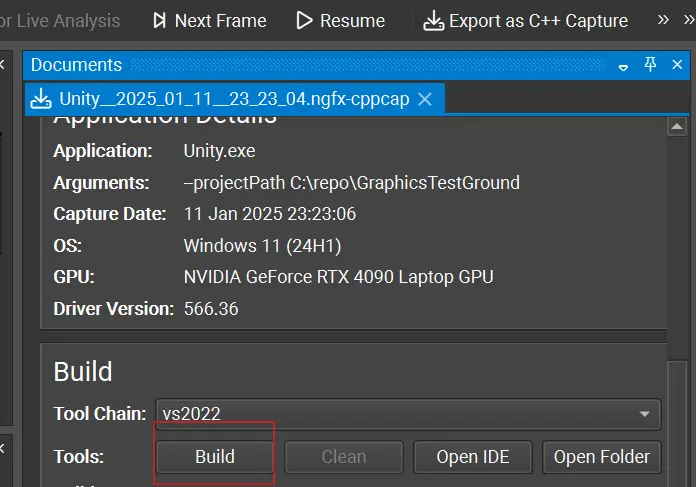
A new window should pop-up below - it represents the C++ Capture of your frame. Navigate to the Build section, and click the Build button. Wait until the build finishes. (You can actually build the capture later, before launching GPU trace)
Now you can close the Nsight.
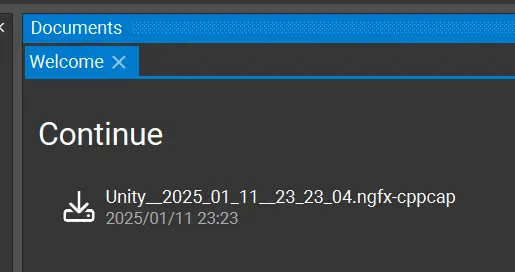
Relaunch the Nsight with Admin rights, navigate to the Continue section of the welcome screen. There you should find your C++ capture. Click it.
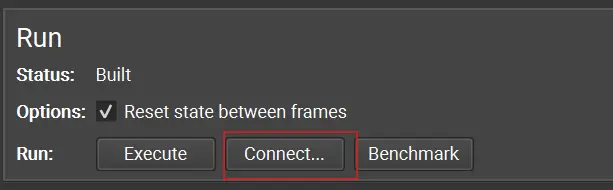
Scroll all the way down to the Run section and click Connect:
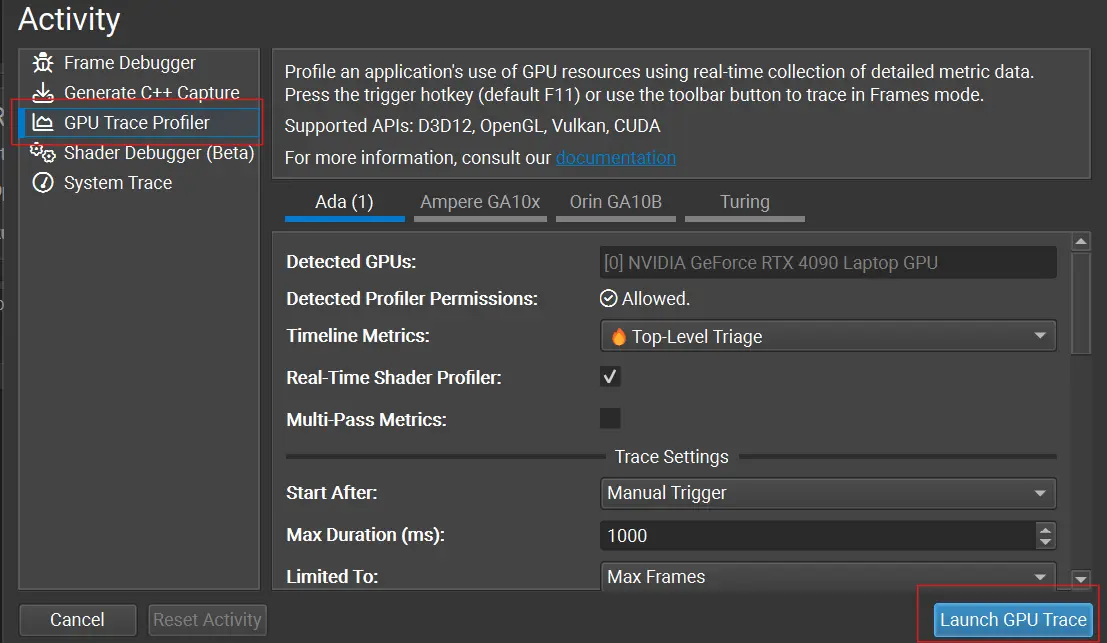
Make sure you select GPU Trace Profiler and click launch:
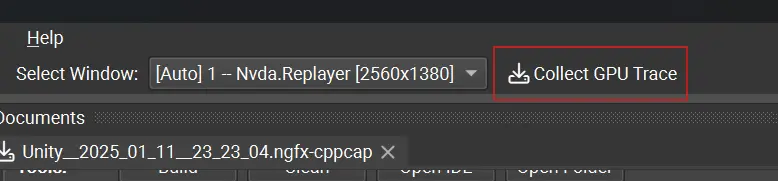
Click Collect GPU Trace after seeing your capture launched:
NOTE : The above screenshot failed to capture as it shows a dropdown box for window selection - it means my PC is using both an embedded GPU and a dedicated GPU. Nsight doesn’t really like that. Force the PC to use discrete GPU via settings should solve the problem.
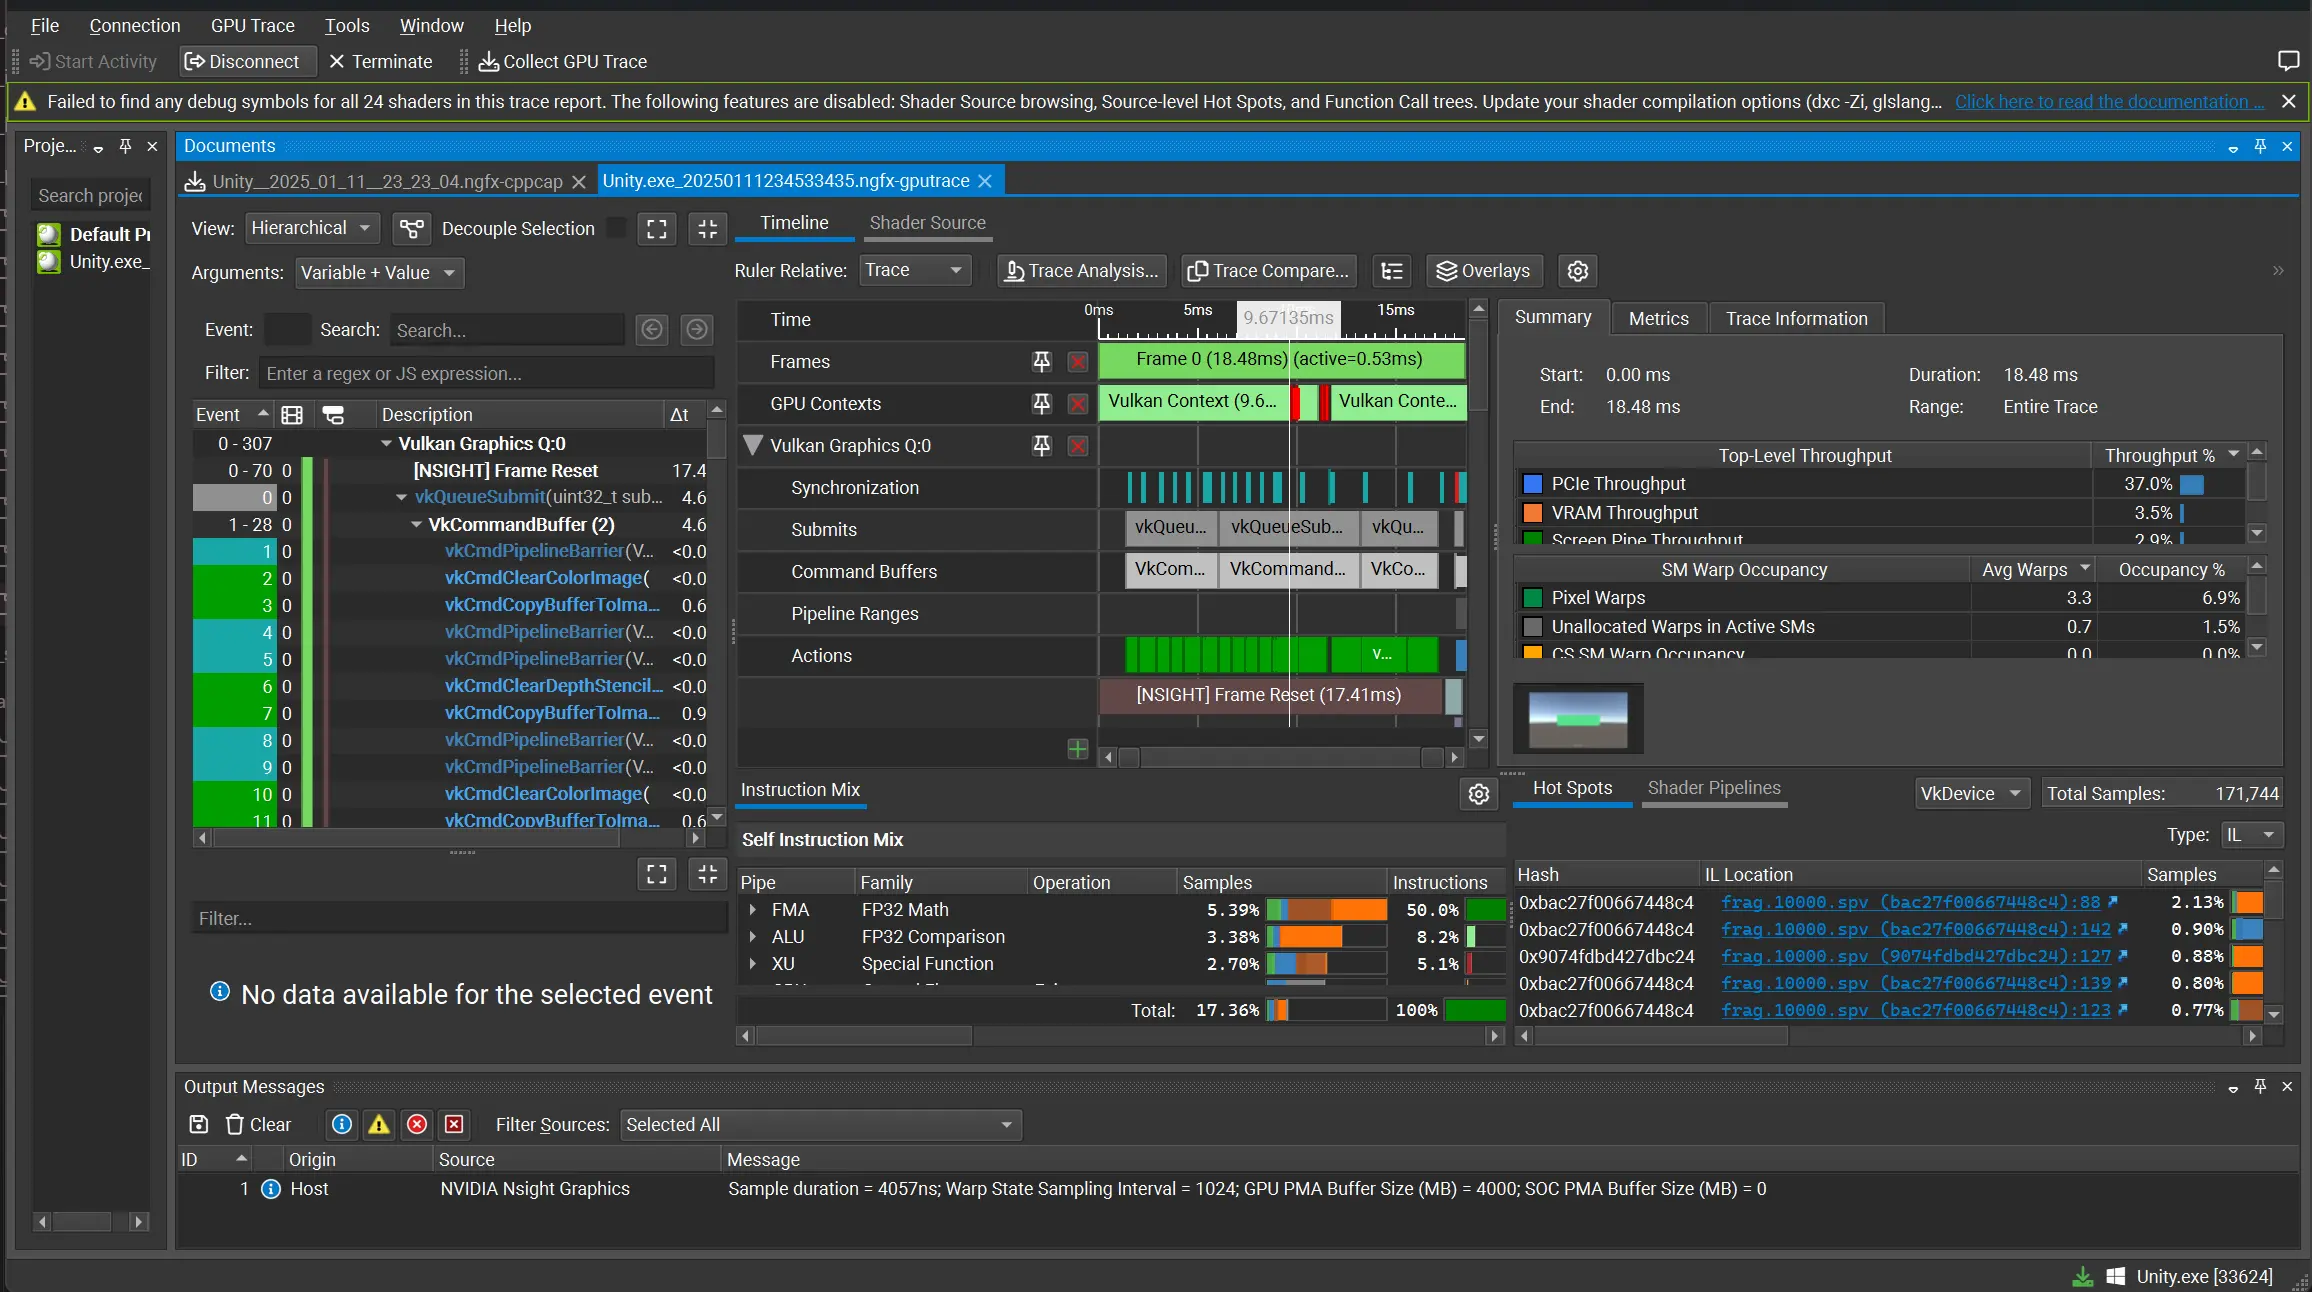
And now you have a complex interface to navigate… From this point on, I suggest looking for the dedicated documentation of the GPU Trace as I simply can’t cover that much content in this post, and many of the concepts are fairly low level.
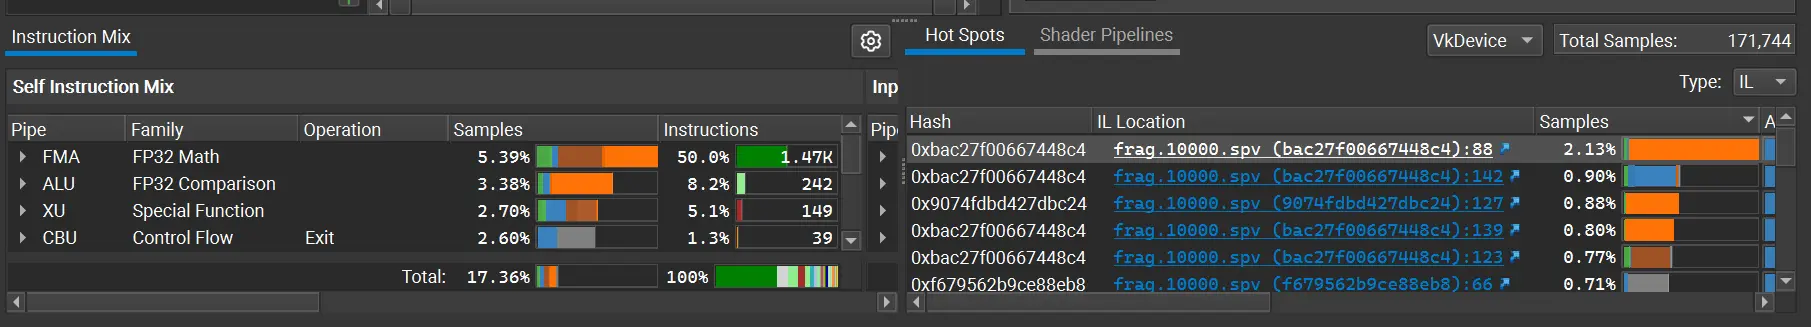
For some quick info, though, the hotspot section shows which shader caused the most performance issue:
Clicking on it will send you to the line where the problem happened:
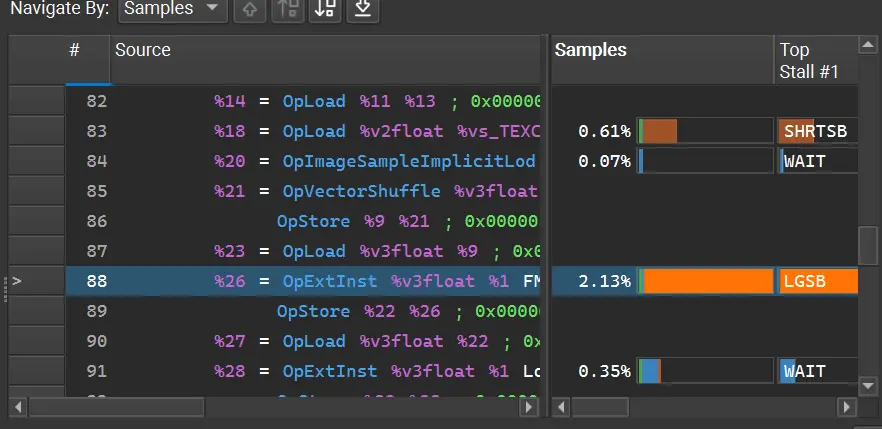
Euh, but this isn’t shader code I’m used to! - true, you will be looking at disassembly code, but usually the issue tells you the root cause and you should be able to pinpoint the line in the original shader code.